How Much Is Your Business Worth?
Business Valuation Explained
It’s said that your business is worth what a buyer is willing to pay for it, but in a competitive, free-market economy in which people have varying degrees of information and limited time to make decisions, how does a prospective buyer determine how much he or she is willing to pay for a business? This is where the discipline of business valuation comes in.
Business valuation is defined as, “A process and a set of procedures used to estimate the economic value of an owner’s interest in a business. Valuation is used by financial market participants to determine the price they are willing to pay or receive to perfect a sale of a business.”1
Besides the buying or selling of a business, there are many other reasons why business valuations are performed:
- Bankruptcy,
- Financial accounting,
- Financings,
- Intergenerational wealth transfer,
- Management information,
- Ownership transition,
- Planning and litigation support,
- Taxation planning and compliance, and
- Transactions.
Business Valuation and Business Strategy
For the scope of this article, I’ll focus on business valuation for buying and selling purposes, or mergers & acquisitions (M&A) activities. You may recall from a previous article, “What Makes You (and Tully’s) Special? A Bain & Co. Primer,” that M&A is a component of business growth strategy, whereby a company may decide to purchase another business to add a new product or service to its portfolio, reach new customer segments, or expand into new markets.
Approaches to Valuation
There are three primary approaches to business valuation:
- Asset-based approach,
- Income approach, and
- Market approach.
The asset-based approach determines value by determining the net asset value (i.e., assets minus liabilities) of the business. Examples of valuation methods that employ an asset-based approach include the adjusted book value method and liquidation value method.
The income approach determines value by calculating the present value of a benefit stream generated by the business. Examples include capitalization of earnings or cash flow, debt-paying ability, dividend discount model (DDM), and discounted cash flow (DCF) model.
The market approach determines value by comparing the subject company to other companies in the same industry, of the same size, and/or within the same region. Examples are the comparable sales method, rule of thumb or industry average method, and the price-to-earnings (P/E) ratio method.
The Zen of Business Valuation
Business valuation methodology is both art and science. The values of each component in the valuation process can be reasonably estimated using concrete financial data available from the companies themselves and/or third-party sources. This is the science of business valuation.
However, to determine the appropriate valuation method(s) and growth model to employ, and the level of business growth to forecast, one must have an intimate understanding of the company being valued and the market in which the company operates. This is the art of business valuation.
In practice, a skilled practitioner will usually employ a combination of income, market, and asset-based approaches to cover all angles. In the small business world, a business broker may value a business using the adjusted book value method coupled with the comparable sales method. In the corporate finance world (think Wall Street investment banks), an equity analyst uses the income approach as the foundation for business valuation and may supplement it with the P/E ratio method to verify his or her estimates.
A commonly used income approach method is the discounted cash flow (DCF) model. In the DCF model, a company’s estimated future free cash flows to the firm (FCFFs) are discounted to present value (PV) using its weighted average cost of capital (WACC), and then summed to estimate the total intrinsic value of the company. This value is known as the total enterprise value (TEV).
The Model
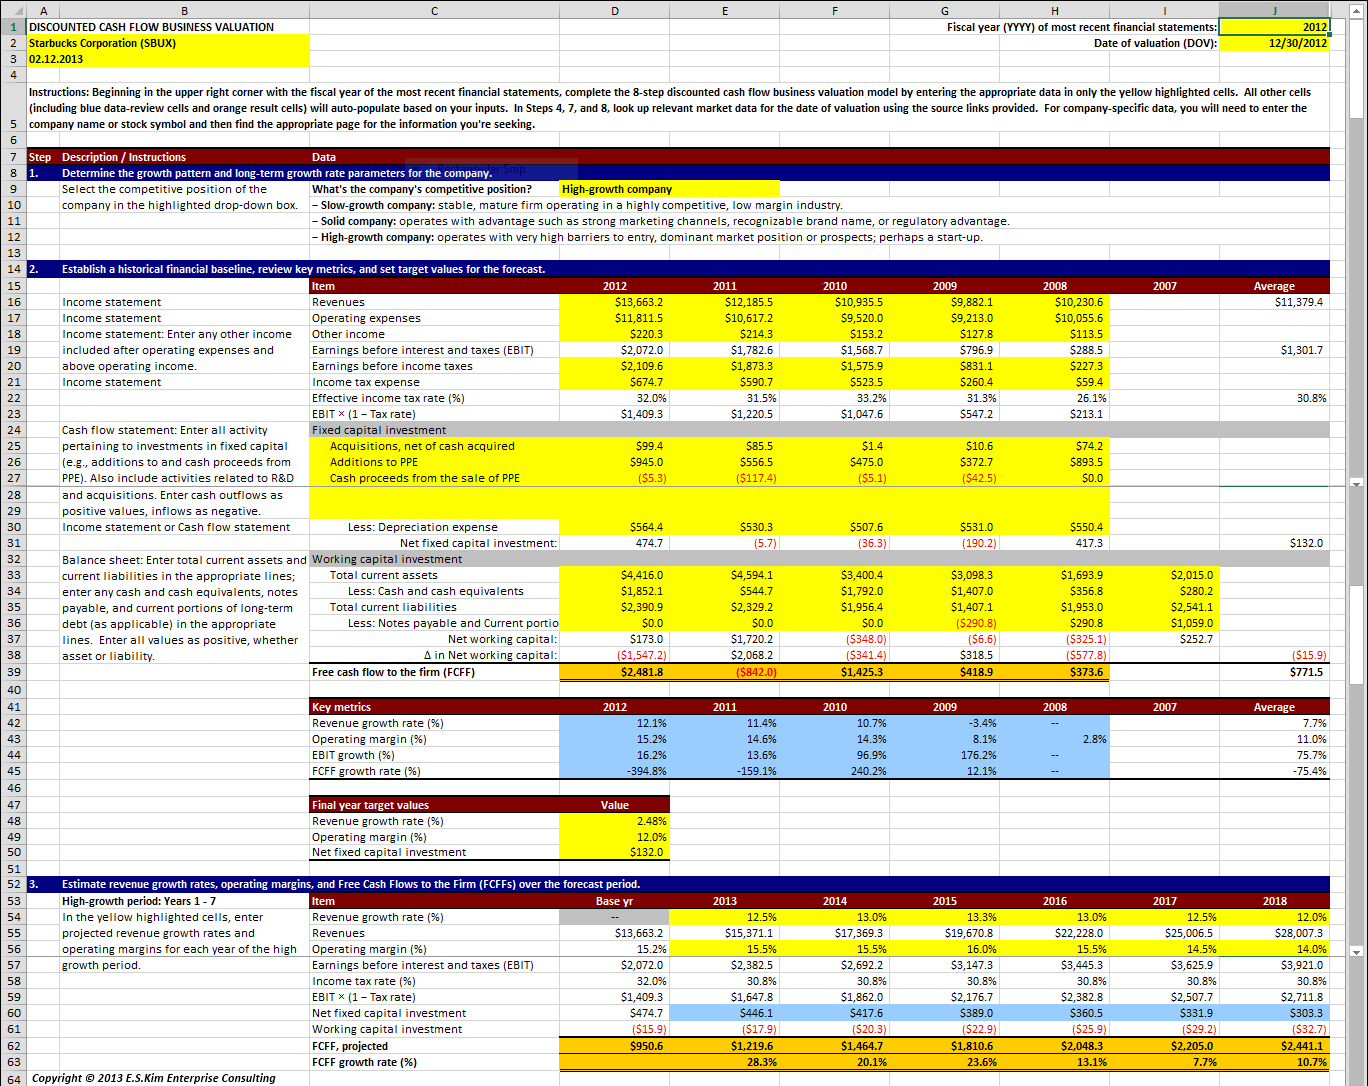
I created a DCF Business Valuation model for Starbucks Corporation (SBUX) and I’ve provided screenshots of the model below. The model has a modular, eight-section design and, if you simply enter the requested data in the yellow highlighted cells, it should provide the total enterprise value (TEV) of the company in Step 6. The model provides a couple additional steps (7 & 8) for use on publicly traded companies to determine how the company’s intrinsic value compares with its stock price.
The DCF Business Valuation model of Starbucks Corp. would look like the following:
 Click on the thumbnail to see the image in its full size.
Some notes on this business valuation model of Starbucks:
- Use of a three-stage growth model with a seven-year high-growth period. Although not a start-up, Starbucks is a dominant player in its industry with highly differentiated competitive advantages, solid leadership, and great brand recognition. It has realized double-digit growth in revenues the past three years and analysts expect this pattern to continue for a few more. Given its unique market position, I estimated a seven-year high-growth period followed by the transition and stable growth periods for this company.
- Use of trailing twelve months (TTM) financial values. For the most accurate data from which to develop the financial baseline, one should use financial information from a company’s most recent 12-month period – known as trailing twelve months (TTM) – leading up to the date of valuation. Starbucks’ most recent fiscal year-end (FYE) date was September 30, 2012. For the company’s five-year historical financial baseline, I adjusted each of Starbucks’ FYE financial information (obtained from its Forms 10-K) by adding and subtracting forward and trailing quarterly information (from Forms 10-Q) to obtain the TTM financial values closest to the date of valuation, December 30, 2012.
- Use of actual (not normalized) financial values. Every once in awhile, a company may have an unusual business event (e.g., a large write-off of an asset or a financial fallout or payday from a lawsuit, etc.) which may produce an unusual spike in its financial statements. To adjust for non-recurring events, it’s best to normalize a company’s financial statements. Additionally, one may also normalize the financial statements to allow for comparisons among different companies operating in the same industry or geographic region, or of similar size. For convenience, I used the actual financial values over the most recent five-year period.
- Domestic market risk and cost of capital. Starbucks is a global company that conducts business in many countries outside the U.S. As such, a more precise estimation of its WACC and equity risk premium would incorporate varying degrees of market risk in all the international markets in which it conducts business.
- Economic viability of the company. If I were concerned, for whatever reason, that a company would not continue to be in business after a certain period of time, say, beyond the next five years, then I would add an additional element to the model to accommodate the probability of business termination and an estimate of its liquidation value. However, I didn’t have any concerns of Starbucks’ economic viability and therefore assumed it would continue as a going concern into perpetuity.
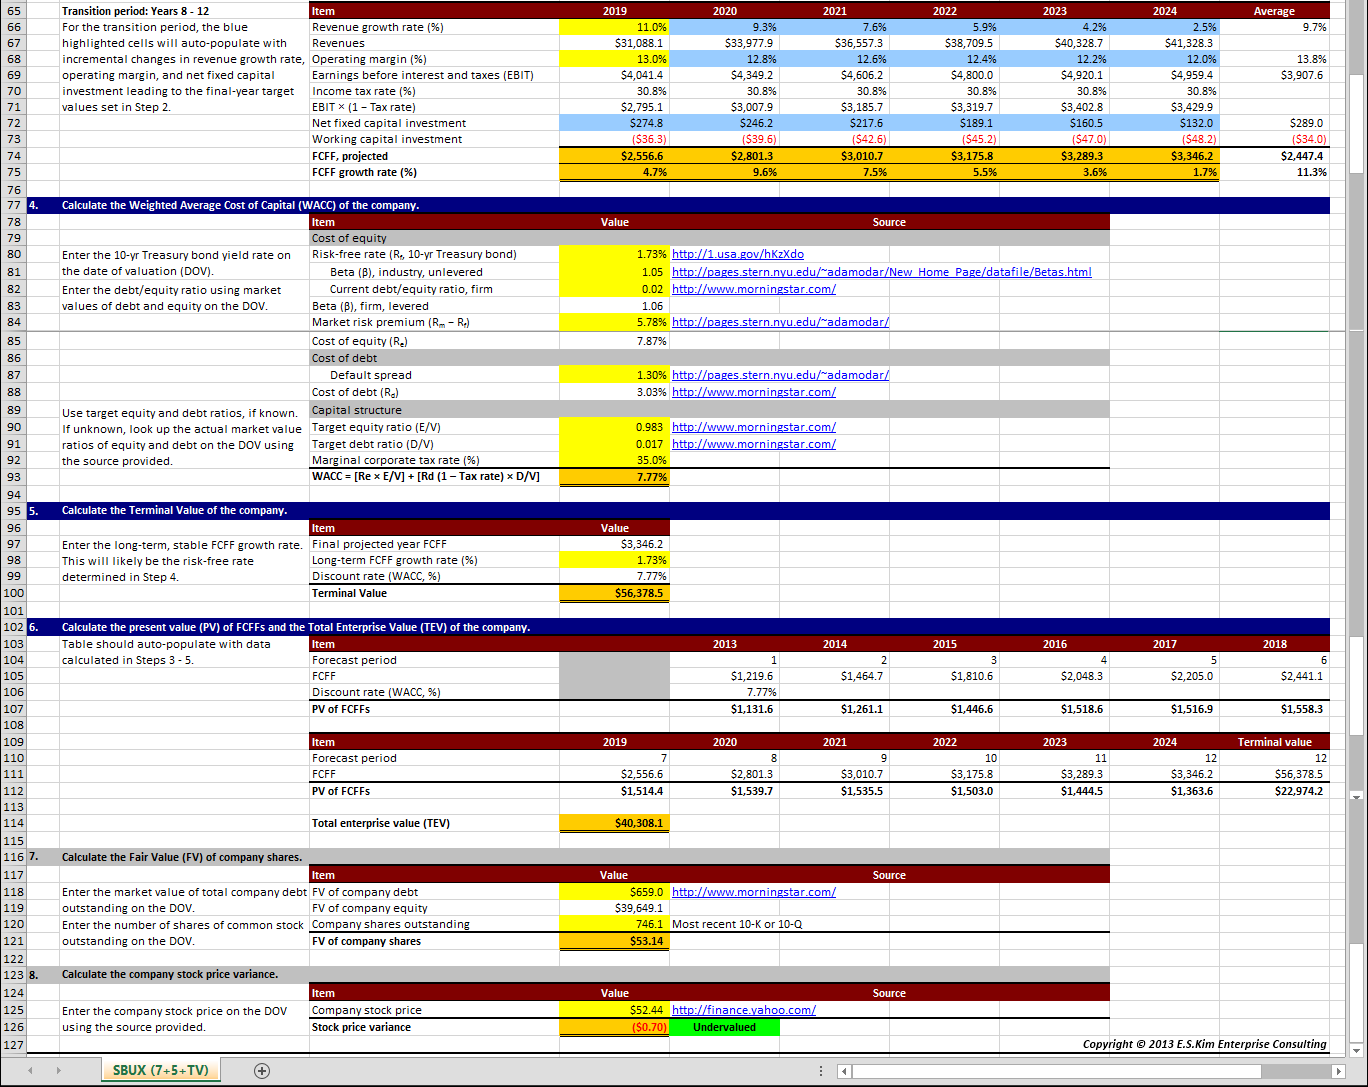
Starbucks’ Intrinsic Value
As you can see, based on my estimates of the specialty coffee company’s future cash flows, Starbucks’ TEV on the date of valuation (December 30, 2012) was $40.308 billion. Its fair value per share was $53.14 and its stock price closed at $52.44 on that date.
The Recipe
Below are the essential steps in the DCF business valuation process:
1. Determine the growth pattern and long-term growth rate parameters for the company.
Is it a stable, mature company in a highly competitive, low margin industry? Is it a fast-growing start-up or a dominant player in its market with a differentiating competitive advantage and strong brand recognition? Or is it a solid leader in its market with established sales and marketing channels and an efficient supply chain system? Consider these factors in determining the growth pattern of the valuation model and the growth rates in revenues and operating margins for the forecast.
The common growth patterns2 are:
- N-stage. Gradual change in growth rate each year leading up to the stable growth period. Most appropriate for very young companies or those with negative operating margins; allows for annual changes.
- Two-stage. Five-year high-growth period with an abrupt change to the stable growth period. Most appropriate for companies with moderate growth rates.
- Three-stage. Five-year high-growth period followed by a five-year transition period of gradual declines leading to the stable growth period. Most appropriate for companies with high-growth rates in operating income; transition phase allows for a gradual adjustment not just of growth rates but also of risk characteristics, returns on capital and reinvestment rates toward stable growth levels.
- Stable growth. One-year forecast period. Company is currently a mature company with a relatively stable growth rate.
2. Establish a historical financial baseline, review key metrics, and set target values for the forecast.
Review at least the past five years of the company’s financial history to develop a financial baseline from which to analyze key metrics and set target values for the forecast. You’ll need to review the income statement, balance sheet, and cash flow statement for the required data. For publicly traded companies, you can review Forms 10-K or 10-Q that the company files each year and quarter, respectively, with the Securities and Exchange Commission (SEC).
3. Estimate revenue growth rates, operating margins, and Free Cash Flows to the Firm (FCFFs) over the forecast period.
Based on the growth model selected in Step 1, develop a pro forma financial statement and estimate revenue growth rates, operating margins, and FCFFs for each year of the forecast period.
4. Calculate the Weighted Average Cost of Capital (WACC) of the company.
The weighted average cost of capital (WACC) is the discount rate commonly used to determine the PV of FCFFs. It’s an average of the company’s costs of equity and after-tax debt based on each component’s relative weight in the company’s capital structure.
5. Calculate the Terminal Value of the company.
This is the value of a company during its stable growth period. It assumes constant long-term growth into perpetuity. This value represents the golden years in the lifecycle of a company after its more active high-growth period.
6. Calculate the present value (PV) of FCFFs and the Total Enterprise Value (TEV) of the company.
Discount all the company’s FCFFs during the forecast period and its terminal value by its WACC to determine the PV of FCFFs. Then, sum all the PVs to get the total enterprise value (TEV). This is the total intrinsic value of the company.
7. Calculate the Fair Value (FV) of company shares.
For publicly traded companies, continue with Steps 7 & 8 to determine if the company’s current stock price is undervalued, par value, or overvalued relative to its intrinsic value. Subtract the fair value (FV) of company debt from the TEV to get the FV of company equity. Then divide the FV of company equity by the number of shares of common stock outstanding to get the FV of company shares.
8. Calculate the company stock price variance.
Compare the FV of company shares with the stock price on the date of valuation to determine the company stock price variance.
External Resources
This article was written to provide a primer on business valuation and this valuation was performed for illustration purposes. Be advised that there are trained, certified professionals that specialize in business valuation. In the small business sector (i.e., businesses under $10 million in annual revenues), business valuations are usually performed by Certified Business Brokers, Certified Public Accountants (CPAs), or certified business appraisers. Some CPAs may have a special credential granted by the American Institute of Certified Public Accountants (AICPA) called Accredited in Business Valuation (ABV).
In the middle market (generally, from $10 to 500 million, the upper limit of which may vary depending on whom you ask), business valuations are typically managed by boutique investment banks or M&A advisory firms. These professionals may or may not contract out the business valuation task of their engagement to a specialist. At the enterprise level, business valuations are typically performed by a financial or equity analyst who may or may not hold the Chartered Financial Analyst (CFA) certification, or a management consultant who specializes in M&A services at one of the large professional services firms.
If you’re interested in having your business appraised for M&A purposes or another purpose involving legal considerations, I’d recommend you contact your CPA or business attorney to get started. They should be able to refer you to a business valuation specialist.
Also, I’d like to thank Professor Aswath Damodaran of New York University Stern School of Business for his review of the model. Professor Damodaran is widely regarded as a leading authority on corporate finance and equity valuation and is recognized for his teaching excellence, having received several professor of the year and other teaching awards. You can visit his web site by clicking on the appropriate link in the references provided below.
How I Can Help
I can help you develop a business valuation or similar quantitative model that helps you to assess your business, from which to develop a sound business strategy. In doing so, I would work with you, your chief financial officer (CFO), finance team, and CPA to coordinate the activities and apply the results of the valuation into an integrated business strategy.
Contact me to learn more about this opportunity. And if you liked what you read, share it with someone in your social network by using the social media buttons below.
References:
- “Business valuation,” Wikipedia, last modified February 7, 2013, http://en.wikipedia.org/wiki/Business_valuation.
- Damodaran Online: http://pages.stern.nyu.edu/~adamodar/.
- “Discounted Cash Flow Analysis: An Introduction,” Investopedia, http://www.investopedia.com/university/dcf/default.asp#axzz2JDItSvZ6.